
A dinosaur-killer asteroid hitting Earth within the next 5 minutes is more likely than you losing money trading with the trend.
Trend pattern probability — 75%, risk/reward ratio — 1:2. 1000 trades
No real-world event is that rare — even an asteroid impact turns out to be incomparably more likely.
Even at 55% with the same 1:2 ratio the conclusion holds: such a loss is roughly 10³⁰ times less likely than a dinosaur-killer asteroid hitting Earth within the next 5 minutes.
notethere are only ~10 zeros here. That is exactly why even an asteroid impact is tens and hundreds of orders of magnitude more likely than your loss trading with the trend
Trend trading is the most effective mathematical model for cracking the stock market
The trend pattern: price in a steady uptrend returns to the higher-timeframe moving average and bounces off it.
1. What does a trend pattern probability of 75% mean?
75% is not a made-up number. It is the share of moving-average touches that actually played out on historical data. Here is IGV (a software-sector ETF) with the touches numbered in order. Green arrows — price touched the moving average and bounced (it worked); red crosses — false touches (a break). Of all the touches, about 75% played out. That is how a pattern’s probability is measured: how many times, out of the total, it worked in the past.
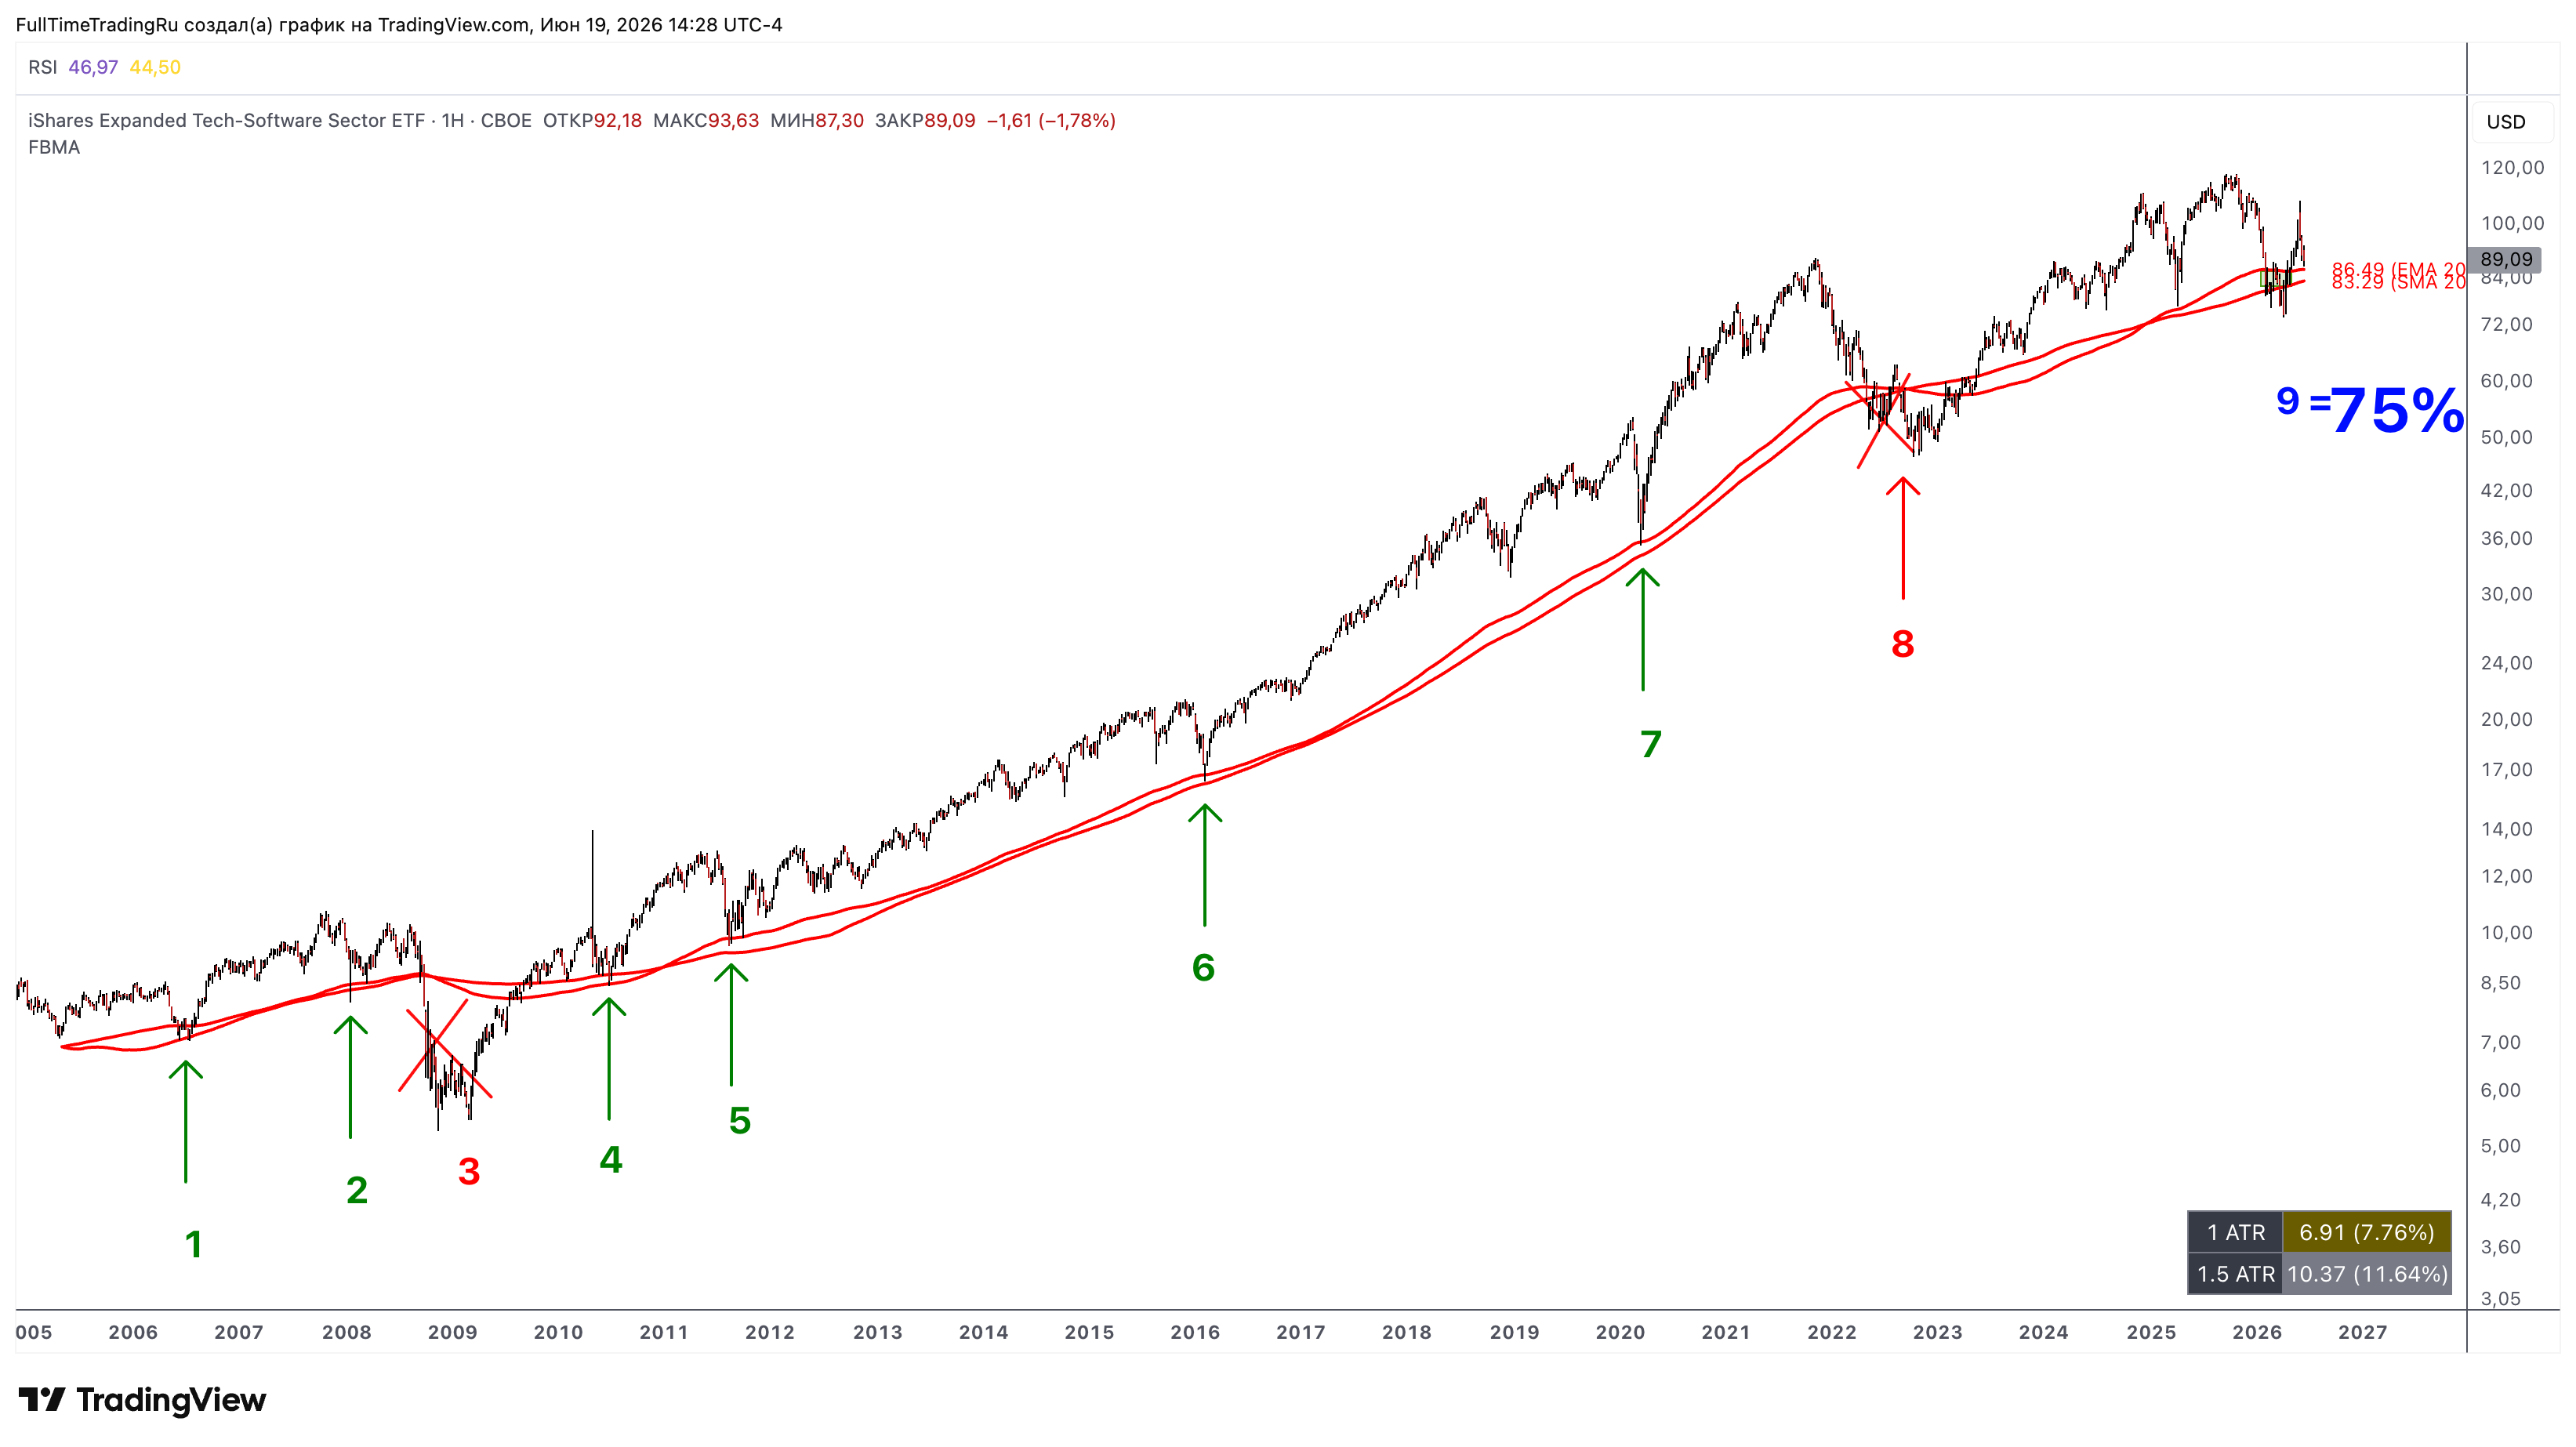
Is the risk/reward here 1:2? Look at the chart — it reaches as much as 1:10.
Past results don’t guarantee future ones? That is exactly the point: mathematicians understand this — which is why they never say the pattern is guaranteed to make money. They say the pattern is more likely to repeat — and we have just measured that probability: 75%.
We look for trend patterns, not range-bounce patterns.
2. Why “1000 times” works
One setup is chance. But if a trade has an edge (positive expected value), then as the number of trades grows the average result converges to that edge — that is the law of large numbers. The more repetitions, the smaller the role of luck. Below is what that means in numbers over 1000 trades, when profit equals risk (1:1) and trades are independent.
How rare is losing when trading with the trend? Real-world analogies
3. And here is the same probability — over a short run
At the very start we calculated that the probability of ending negative over 1000 trades is nearly zero (down to dozens of zeros after the decimal point). But that “near impossibility” is entirely the work of distance. Shorten the number of trades — and the chance of a loss grows by dozens of orders of magnitude.
The zeros vanish fast as the series gets shorter. The edge only works over the long run — over a short stretch an individual series can easily go negative, so profit is not guaranteed here, and it matters that you “survive to the distance”.
4. After this text you no longer have the right to say you can’t make money in the stock market.
Your brain was deceiving you not because the market is hard, but because you didn’t know the math.
Don’t trust emotions. Trust the numbers. Trade with the trend.
Profit over a short run is not guaranteed
Honestly: where the “almost” hides
- Probability without R is half the equation. Even 75% will blow up an account if the wins are small and the losses are large. Move the R slider — watch the risk grow.
- It is measured on the past. The 75–88% figures are computed on history; in the future the edge may weaken, and you will land in a row with a lower probability.
- Trades are correlated. In a single crisis half the touches break the moving average at once — the spread is wider and the odds of a loss fatter than in the ideal model.
- You have to survive to the distance. The “after 1000” numbers do not cover the risk of zeroing your account along the way. That is why the stop, break-even and position size are the condition under which the statistics get a chance to work at all.
Are you ready to trade with the trend?
5. Study the benchmark examples in high resolution, understand the criteria — and submit setups just like these to the portfolio ideas.
Example catalog
Catalog charts are Pro-only
Filters and topics are open to everyone. The benchmark charts themselves, in high resolution, are available to Pro only.
Go Pro to unlock the charts →What to submit as ideas
Found an instrument with the same kind of touch? Take a high-resolution screenshot in TradingView and send it to the portfolio ideas.
Open the idea form →Remember: we earn wholesale, not retail. Not on a single pattern, but only across 1000 patterns